15 Best Recruiting Metrics to Track in 2025 (Free Template)

Neha Jain
Recruitment metrics are the basis for evaluating your hiring efforts by tracking key performance indicators. These metrics can help you understand what’s working, what’s not, and where to improve.
Tracking recruiting metrics can also optimize your hiring process and help you make data-driven changes. But why exactly do recruiting metrics matter? And how can you track them without spending hours on manual reporting?
In this blog, we’ll explore:
Just like a business tracks its finances with detailed reports, it should also track its hiring efforts. After all, on average, 15% of a company’s budget goes to human resources. So, making the best use of it is crucial.
Recruitment metrics can help you understand how your decisions impact hiring and help you make better decisions.
Let’s understand this using examples of hiring metrics. Through sourcing hire effectiveness, you see which channels bring in the best candidates. If job boards generate 70% of applications, but referrals result in 50% of successful hires, focusing more on employee referrals could lead to quality hires in less time.
With regular recruiting metrics tracking, you can find from which source you are getting the best candidates and invest your resources accordingly.
Instead of spreading your budget across multiple platforms, you can focus on the most effective ones.
For example, if Indeed provides better-qualified candidates than LinkedIn, you can identify it by recruiting metrics. And increase your investment in Indeed while reducing spending on LinkedIn.
By tracking recruitment analytics like applicant drop-off rate, you can identify where candidates abandon applications and make improvements to keep them engaged.
For instance, if data shows that most applicants drop off at the skill assessment stage, it might indicate that the test is too long or complicated.
Hiring the right people is the first step. You also need to keep them motivated and satisfied with the job.
Recruitment metrics help in identifying the same. For example, by tracking recruitment analytics like first-year attrition rate, you can identify why employees leave early and take steps to improve retention.
Top candidates often have multiple job offers, and a slow or uncompetitive hiring process can cause you to lose them.
Tracking the job offer acceptance rate helps you see if candidates choose your company or go elsewhere.
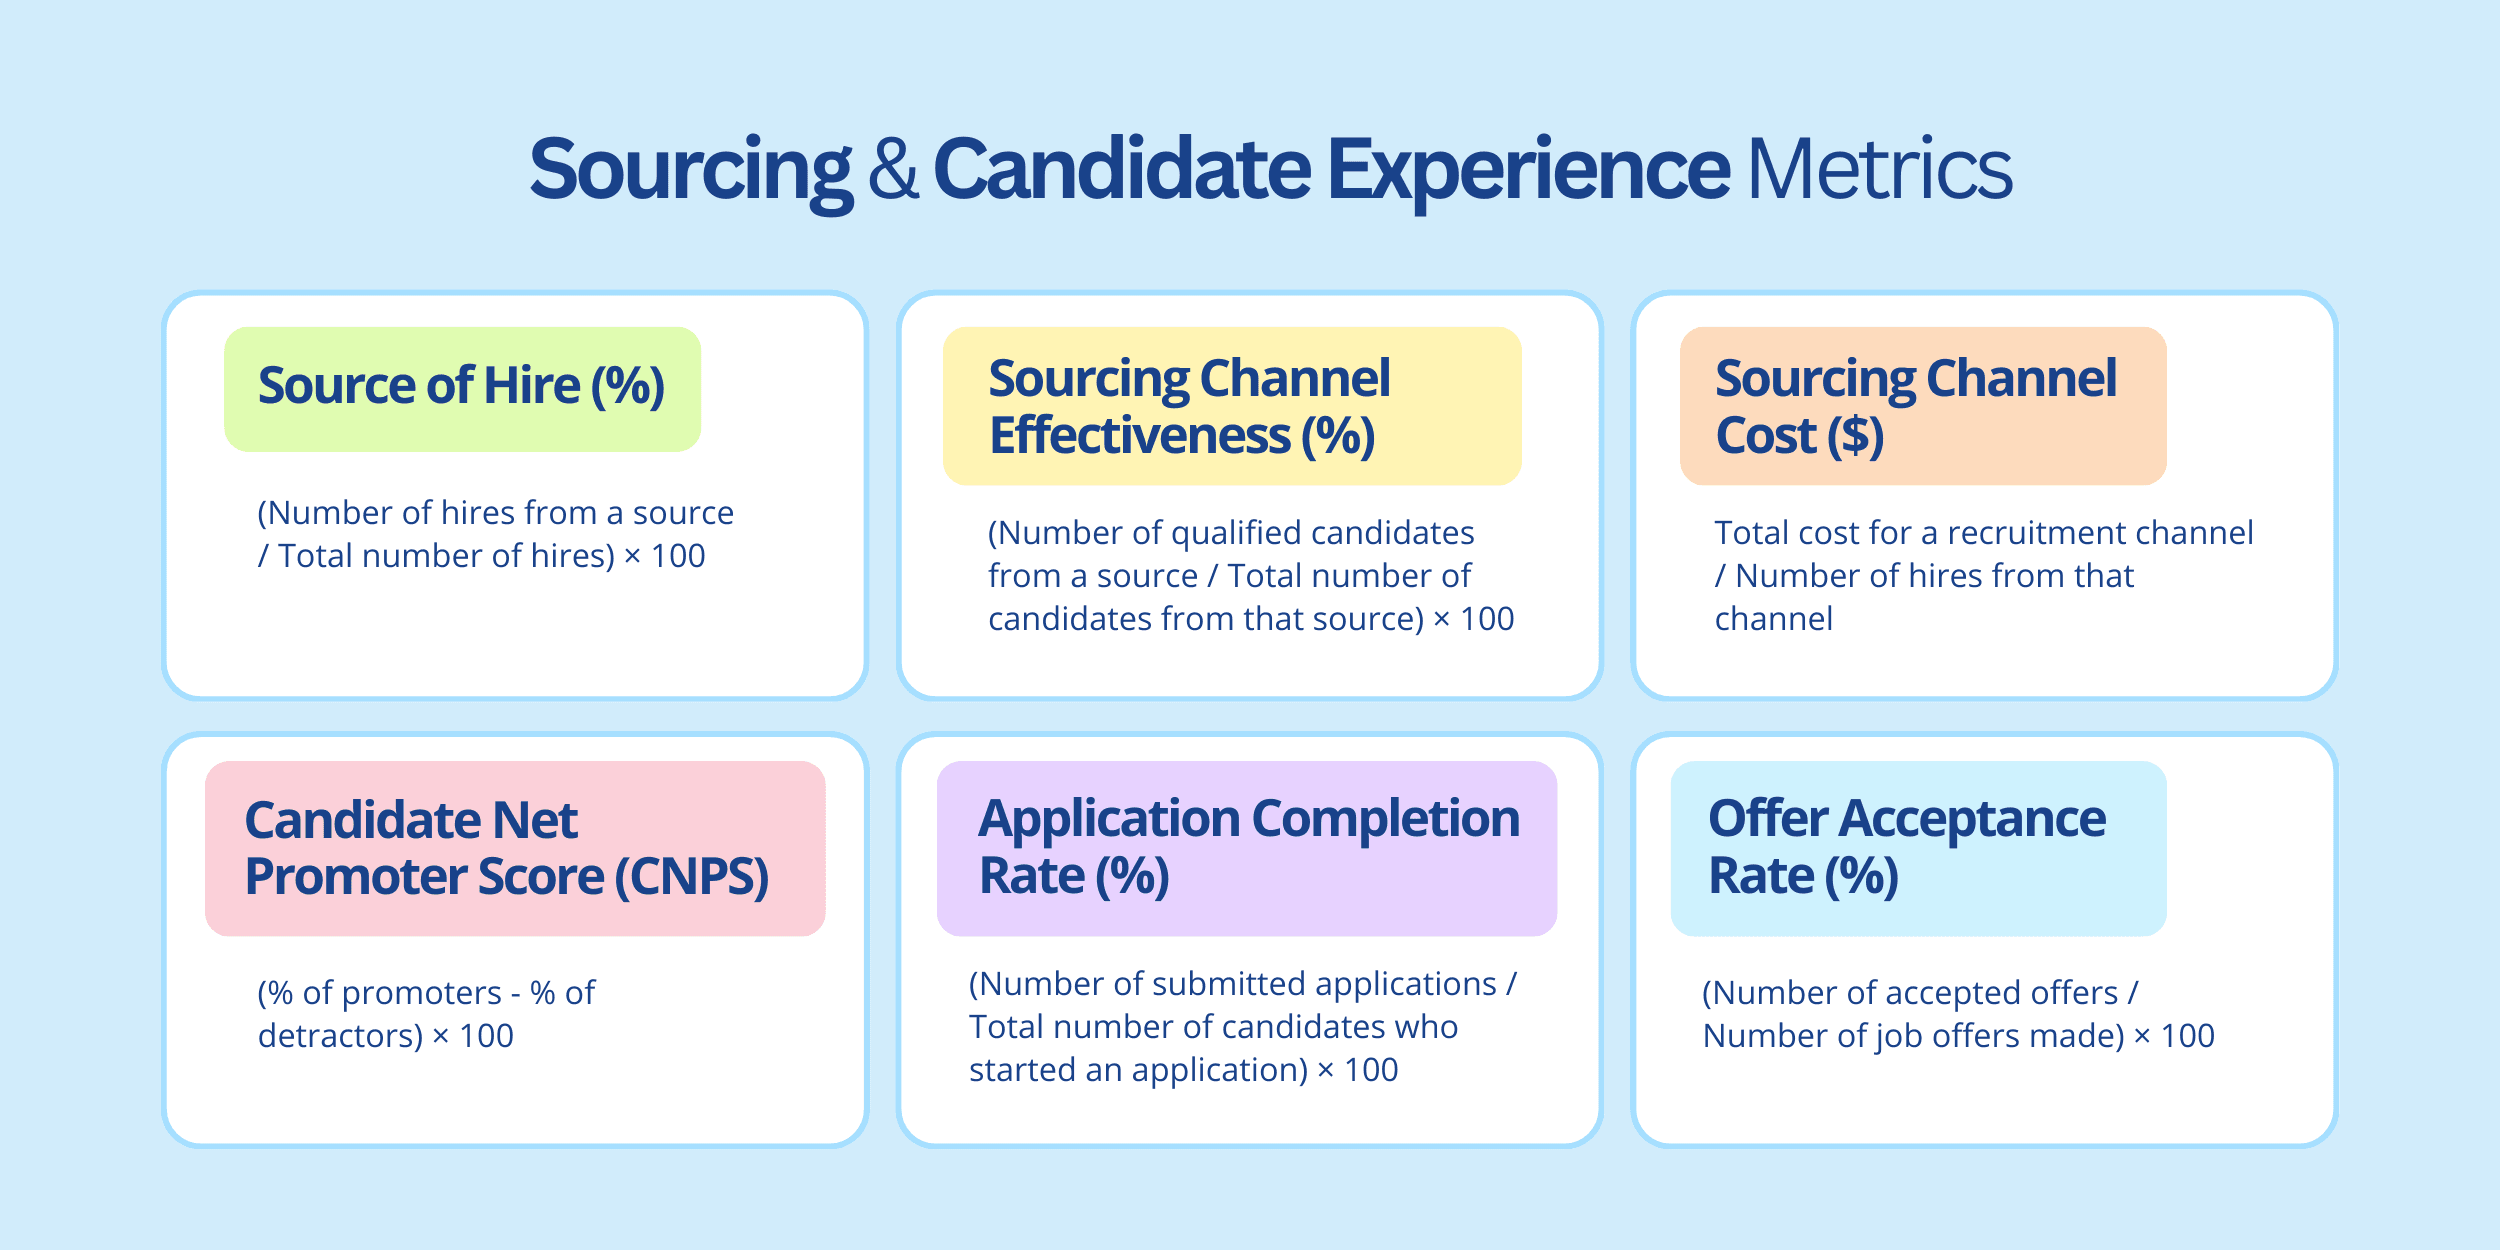
This metric helps you understand where most of your candidates come from. You can calculate these HR metrics by calculating the number of hires from a single source and dividing it by the total number of hires.
Formula: Source of hire = Number of hires from a source / Total number of hires
Example: If your company hires 25 marketing specialists, the sources of hires are as follows: 10 came from job boards, 5 from the career page, 6 from social media, and four from employee referrals.
The calculations are:
Why calculate: It helps you determine which platform or agencies to invest in and reduces the cost of non-performing sources.
Tip: Calculating the can increase your business towards one source or agency; always match this with the average time to file for better decisions.
If you want to calculate a particular source’s performance, use this metric. To measure, calculate the total qualified candidates from any source and divide it by the total number of candidates you get from that source. The source of hire measures the distribution of hires from different sources, whereas sourcing channel effectiveness calculates the percentage of qualified candidates from a specific source.
Formula: Number of qualified candidates from a source / Total number of candidates from that source) x 100
For example:
Job Boards: 50 applicants, 20 qualified
Career Page: 40 applicants, 15 qualified
Social Media: 30 applicants, 10 qualified
Employee Referrals: 20 applicants, 12 qualified
Using the formula:
Job Boards: (20 / 50) × 100 = 40%
Career Page: (15 / 40) × 100 = 37.5%
Social Media: (10 / 30) × 100 = 33.3%
Employee Referrals: (12 / 20) × 100 = 60%
Why calculate: SCE HR Metrics help you determine which channel candidates come from with the lowest cost.
Tip: To make this metric more reliable, consider the number of quality candidates drawn from each channel within a set time frame.
Cost is a critical factor in deterring recruiting success; this metric helps you calculate it. To find the cost of a single sourcing channel, calculate the total cost you are incurring on a recruitment channel and divide it by the total number of hires you made from that channel.
Formula: Sourcing channel cost = Total ad cost for a recruitment channel / Number of hires from that channel
Example: If your company spends the following amount on different recruitment boars and hires a set number of candidates:
Job Boards: $5,000 spent, 10 hire
Using the formula:
Job Boards: $5,000 / 10 = $500 per hire
Why Calculate: These HR metrics can help you understand the health of your candidate pipeline and important sourcing channels.
Tip: If you want better insight from these HR metrics, include churn rates, retention, the cost of a bad hire, quality hires, and other key factors. Continue reading to find the formula for each of these recruiter metrics.
Time to fill metrics show how long it took for your team to fill vacant positions from job requisition to candidate acceptance.
Formula: (Total number of days to fill all positions) / (Total number of positions filled) = time to fill
Example: A company took 90 days to fill 6 positions.
Time to Fill = 90/ 6 = 15 days per position
Why calculate: The metrics help you determine how efficient your hiring process is. A longer time to fill could indicate bottlenecks, difficulty finding qualified candidates, or issues with the hiring process.
Tip: The starting and ending points may differ for different organizations. For example, some consider it when the HR department creates the job opening, while others think it is when the hiring manager submits the job request. The same goes for the ending day. The end date is mostly when the candidate accepts the job offer.
Time to fill was more focused on the organization’s recruitment process. However, time to hire focuses on candidates’ overall experience. It calculates the difference in the day the candidate entered only your pipeline from the day they accepted the offer.
Formula: Time to hire = The day the candidate accepted the offer – The day the candidate entered the pipeline
Example: A candidate entered the hiring pipeline on March 1st.
The candidate accepted the job offer on March 21st.
Time to Fill = 21 −1 = 20 days
Why calculate: It helps you improve your candidate experience as well as show how quickly your company responds to talent needs.
Tip: You can calculate your average time of hire by calculating each candidate’s total time of hire and dividing it by the total number of candidates. The average time to hire is about 24 days, but it can vary by industry.
If you struggle to provide a satisfactory candidate experience, this KPI recruitment metric is all you need. This recruitment analytic is derived from the net promoter score. The net promoter score shows how likely a person is to recommend a brand to another person. Similarly, the net promoter score measures how likely a candidate will recommend your company to tier friends and colleagues. To calculate it, you need to ask all your candidates a simple question: How likely will they be to comment on your company on a scale of 1-10?
Now, you will need a percentage of each group to calculate NPS. Check the example to understand better.
Formula: Candidate NPS = (% of promoters – % of detractors) x 100
Example: Suppose 100 candidates responded to your survey with the following ratings:
30 candidates rated 9–10 (Promoters)
50 candidates rated 7–8 (Passives)
20 candidates rated 0–6 (Detractors)
Step 1: Calculate Percentages
% of Promoters = (30 / 100) × 100 = 30%
% of Detractors = (20 / 100) × 100 = 20%
Step 2: Apply the Formula
Candidate NPS =(30%−20%)×100
Candidate NPS= 10
Note: You can then compare your NPS with the industry standard to take action.
The application completion metric calculates the percentage of completed applications based on the total number of applications the candidate started filling. It gives you an idea of how user-friendly your application form is.
Formula: Application completion rate = (Number of submitted applications / Total number of candidates who started an application) x 100
Example: Suppose 500 candidates started an application and 300 candidates successfully submitted the application
Application Completion Rate= (300/ 500)×100 = 60%
Why calculate: You can miss out on good candidates if your application is difficult to complete. This rate will help you make your application process better.
Quality of hire is one of the most important talent acquisition metrics for recruiters that states any new hire’s impact on an organization. While this is a qualitative HR metric, many companies use data to improve their decision-making process.
Formula: QoH= (Attribute 1+Attribute 2+Attribute 3+…)/Total Number of Attributes Considered
Why calculate:
You can combine the quality of hire metrics with the source of hire to determine the exact return on investment from different job sources.
Tips: Remember, the quality to hire is subject to the data collected. The best way to find the data is to send a customized survey to hiring managers and candidates.
First-year attrition is A metric that reveals three things about an organization: the recruitment process, onboarding procedures, and workplace culture. To calculate this metric, calculate the number of employees in the organization in the first year and divide it by the total number of hires you made in that year.
Formula: First-year attrition = (number of employees leaving within one year / Total number of hires in that year) x 100
Example: A company hired 100 employees in a year. 25 of them left within the first year.
First-Year Attrition=(25/100)×100=25%
Why calculate: This metric can help you identify ineffective screening or training procedures. It also suggests that the company culture doesn’t align with new hires.
Tip: Many organizations have an average attrition rate of 10-20%. This can vary from year to year or from business to business.
Cost-per-hire metrics help to identify the total expenses an organization incurs in hiring new employees. It can include sourcing, equipment, administrative fees, and employee benefits.
Formula: Cost per hire = (Total internal recruiting costs + Total external recruiting costs) / Total number of hires
Example:A company spends:
$50,000 on internal recruiting
$30,000 on external recruiting
Hires 20 new employees
Cost per Hire=50,000+30,000/ 20 =4,000
Final Cost per Hire = $4,000 per employee
Why Calculate: These recruiting analytics help determine whether you are spending as per industry standards to attract candidates.Tip: The cost-to-hire recruiter metrics can be different for different levels of hiring. The average cost to hire an employee is $4700.
The offer acceptance rate is calculated by the number of candidates who accepted a formal job offer and the number of jobs offered by an organization.
Formula: Offer acceptance rate = (number of accepted offers/number of job offers made) X 100
Why calculate: A reasonable offer acceptance rate can signify your company is popular among candidates. A low rate can state the demand for talented candidates in the industry or candidates receiving a better offer elsewhere.
Tip: A reasonable offer acceptance rate is typically around 80%. You can improve the offer acceptance rate by offering attractive conditions, better screening, and competitive wages.
Applicants per role is measured by the average number of candidates applying for each job opening. To calculate it, you need to divide the total number of applicants by the number of job openings.
Formula: Applicants per Job = Total Number of Applicants/Total Number of Job Openings
Example: A company receives 500 applications for 10 job openings.
Applicants per Job=500/10=50
Result: 50 applicants per Job opening
Why Calculate: This talent acquisition metric can help you determine the attractiveness of a job in the current job market. If the number of applicants per job is too low, recruiters may need to adjust job ads, salaries, or sourcing strategies.
Note: The average number of applicants per open role is 118, but the number may vary depending on the industry, role, and location of the company.
Applicant to hire is calculated by dividing the number of candidates who apply for a position by the number of people employed.
Formula: (Total number of applications / Total number of hires)
Example: A company received 1,000 applications and successfully hired 50 employees.
Applications per Hire= = 1,000/50 = 20:1
This means if a company receives 20 applications for a position and they hire 3 people.
Why calculate: The ratio explains how much effort island resource is needed in the hiring process. For example, if a company has a high-risk ratio, they need to make more specific job decisions to get quality candidates.
Tips: You can make your applicant-to-hire process much faster with an AI candidate scoring tool.
Interview to hire is calculated by comparing the total number of interviews with the total number of hires.
Formula: Interview to hire ratio = Total number of interviews / Total number of hires
Why calculate: It offers insight into how selective your hiring process is and the number of interviews to conduct to hire successfully. A high ratio indicates the company needs to improve the screening process or find filling positions difficult.
Tip: The average interview-to-offer ratio is 4.8:1, whereas a good ratio is 3:1 or better.
The candidate callback rate calculator is the number of candidates contacted for the next step in the hiring process. It is calculated by dividing the total number of candidates invited to follow up on the interview by the total number of candidates initially considered or interviewed.
Formula: Candidate Call Back Rate = (Number of Callbacks / Total Number of Candidates Screened or Interviewed) × 100
Example: A company conducted 40 initial interviews, and 10 candidates were invited for a second interview.
Candidate Call Back Rate
=(10/40)×100
=25%
Why calculate: The metric indicates how candidates move through the hiring stages. A higher candidate callback rate shows the number of candidates meeting the required criteria. On the other hand, lower callback rates suggest the need for precise job descriptions or better screening procedures.
Tip: the attractiveness of the company and the level of interest from candidates can also affect your callback rates.
A hiring process with too many steps can slow things down and frustrate candidates. Not every stage adds value, so review each process regularly to remove unnecessary steps. For example, if your company has four interview rounds, but one isn’t helping filter candidates, it should be removed.
Recruiters spend a lot of time reviewing resumes, searching for candidates, and scheduling interviews. These time-consuming tasks can quickly slow down hiring and cause delays. AI hiring tools can help by automatically screening resumes and ranking candidates based on skills and experience.
Many companies track where candidates come from—job boards, company career pages, or employee referrals—but they don’t always measure how quickly hires are made from each source.
A job board may bring in more applicants, but if employee referrals result in faster and better hires, it’s worth investing more in referral programs.
If your organization’s offer acceptance rate drops below 60%, reviewing what might turn candidates away is essential. It could be a sign of issues in the hiring process.
The salary may be low, the hiring timeline may be extended, or your company benefits might not be competitive. Companies that revise their compensation packages to offer remote work options or speed up offer approvals often see more candidates accepting their offers.
Hiring processes should evolve based on results. Instead of considering all talent acquisition metrics at once, you can focus on improving one metric at a time. For instance, you can start with the time to fill a position. Minor, consistent improvements have the most significant impact over time.
Understanding recruiting analytics is one thing, but implementing them is a different challenge. To get started, you have 2 options. Hiring teams often spend too much time on manual reporting without proper tracking. That’s where hiring software can help. It streamlines your hiring and gives you data-driven insights.
For example, Recooty, the world’s first AI-powered hiring tool, makes tracking and understanding recruitment data easy. It creates simple reports to quickly see what’s working and needs improvement.
The best part is you get weekly auto-generated reports to track hiring performance and improve results. No need for manual data collection. Just focus on better hiring decisions.
Try it free for 14 days with no obligation!
Download the free sheet below if you’re not ready for automated reporting yet. It comes with a ready-to-use recruiting metrics template where you can input your hiring data, and it will automatically calculate the key recruiting analytics for you.
A recruiting metric is a way to measure how well a company’s hiring process is working. These metrics track things like where candidates come from, how long it takes to fill a job, the quality of hires, and the cost of hiring.
KPIs (Key Performance Indicators) in recruitment are specific numbers that show whether hiring efforts are successful. Examples include time-to-fill, cost-per-hire, candidate satisfaction, and quality of hire. These help companies track progress and improve their recruitment process.
Recruitment effectiveness is measured using key metrics such as time-to-fill, cost-per-hire, and quality of hire. Companies also use tools to track applicant completion rates, diversity hires, and recruitment yield ratios to see what’s working and where improvements are needed.
A great example of a strategic recruiting metric is Quality of Hire. This measures how well new hires perform and how long they stay with the company. It can be tracked through manager feedback, employee retention rates, and performance reviews.
Recruitment is measured by looking at different factors like time taken to fill roles, cost of hiring, quality of new employees, and candidate experience. Tracking where applicants come from and how long they stay in the company also helps improve hiring strategies.